National Dashboards
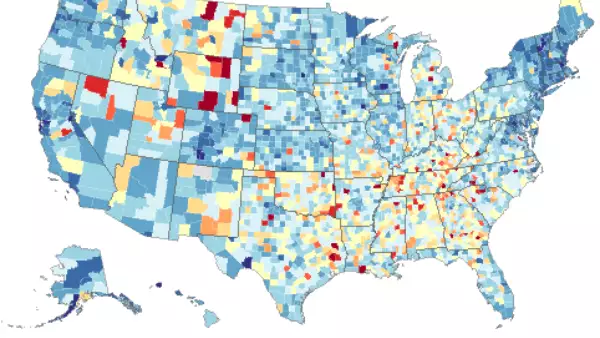
IHME Vaccine Hesitancy Dashboard
This map highlights areas of the US that would benefit most from increased vaccination acceptance. Data source: The Delphi Group at Carnegie Mellon University U.S. COVID-19 Trends and Impact Survey, in partnership with Facebook.
View Dashboard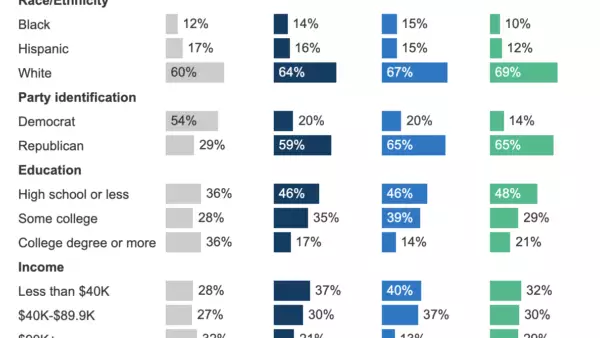
COVID-19 Vaccine Monitor
This dashboard, by Kaiser Family Foundation, showcases vaccination intentions by demographic group.
View Dashboard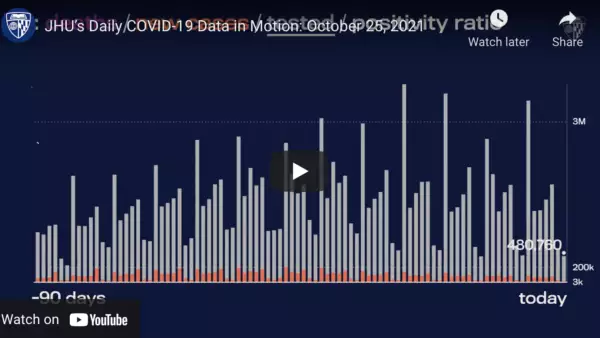
Daily COVID-19 Data In Motion
JHU’s Daily COVID-19 Data in Motion report shares critical data on COVID-19 from the last 24 hours.
View DashboardCDC Vaccination Data and Tracker
The Centers for Disease Control offers visuals of the state of vaccination, updated daily.
View DashboardInternational Dashboards
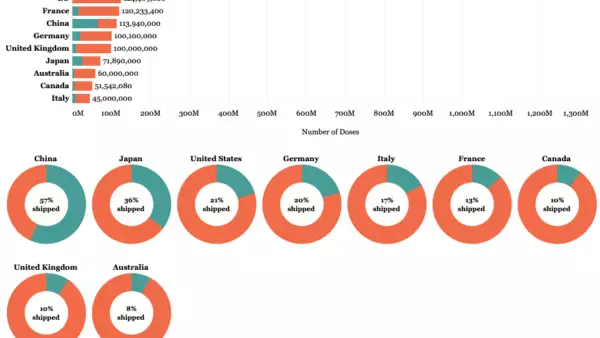
Duke Launch & Scale Speedometer
Duke's Global Health Innovation Clinic tracks the race for global COVID-19 vaccine equity through data collection on procurement and manufacturing of vaccines to better understand global equity challenges.
View Dashboard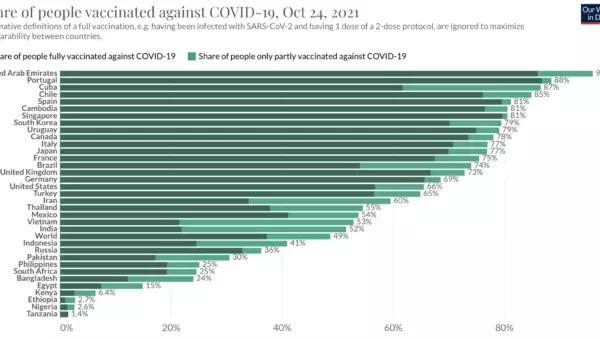
Our World in Data COVID-19 Data Explorer
This interactive graph, by Our World in Data, highlights the share of the population in several countries who received at least one dose of the COVID-19 vaccine.
View Dashboard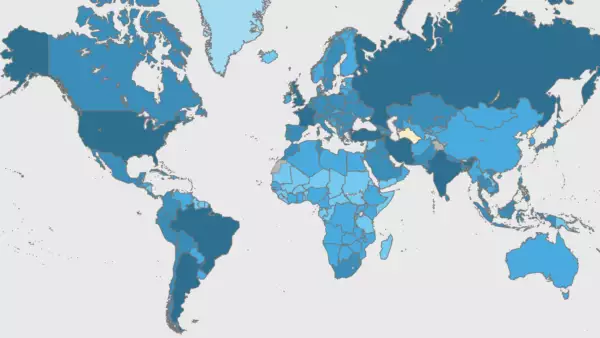
WHO Coronavirus (COVID-19) Dashboard
This interactive world map, by the World Health Organization, shows confirmed cases, new cases, deaths, and vaccine doses administered by country as well as broad "transmission classification" by country.
View Dashboard